BIGGER PICTURE Energy & climate
A shorter queue can begin with a few seconds of green
Boston used existing traffic signals differently after AI identified timing changes worth testing.
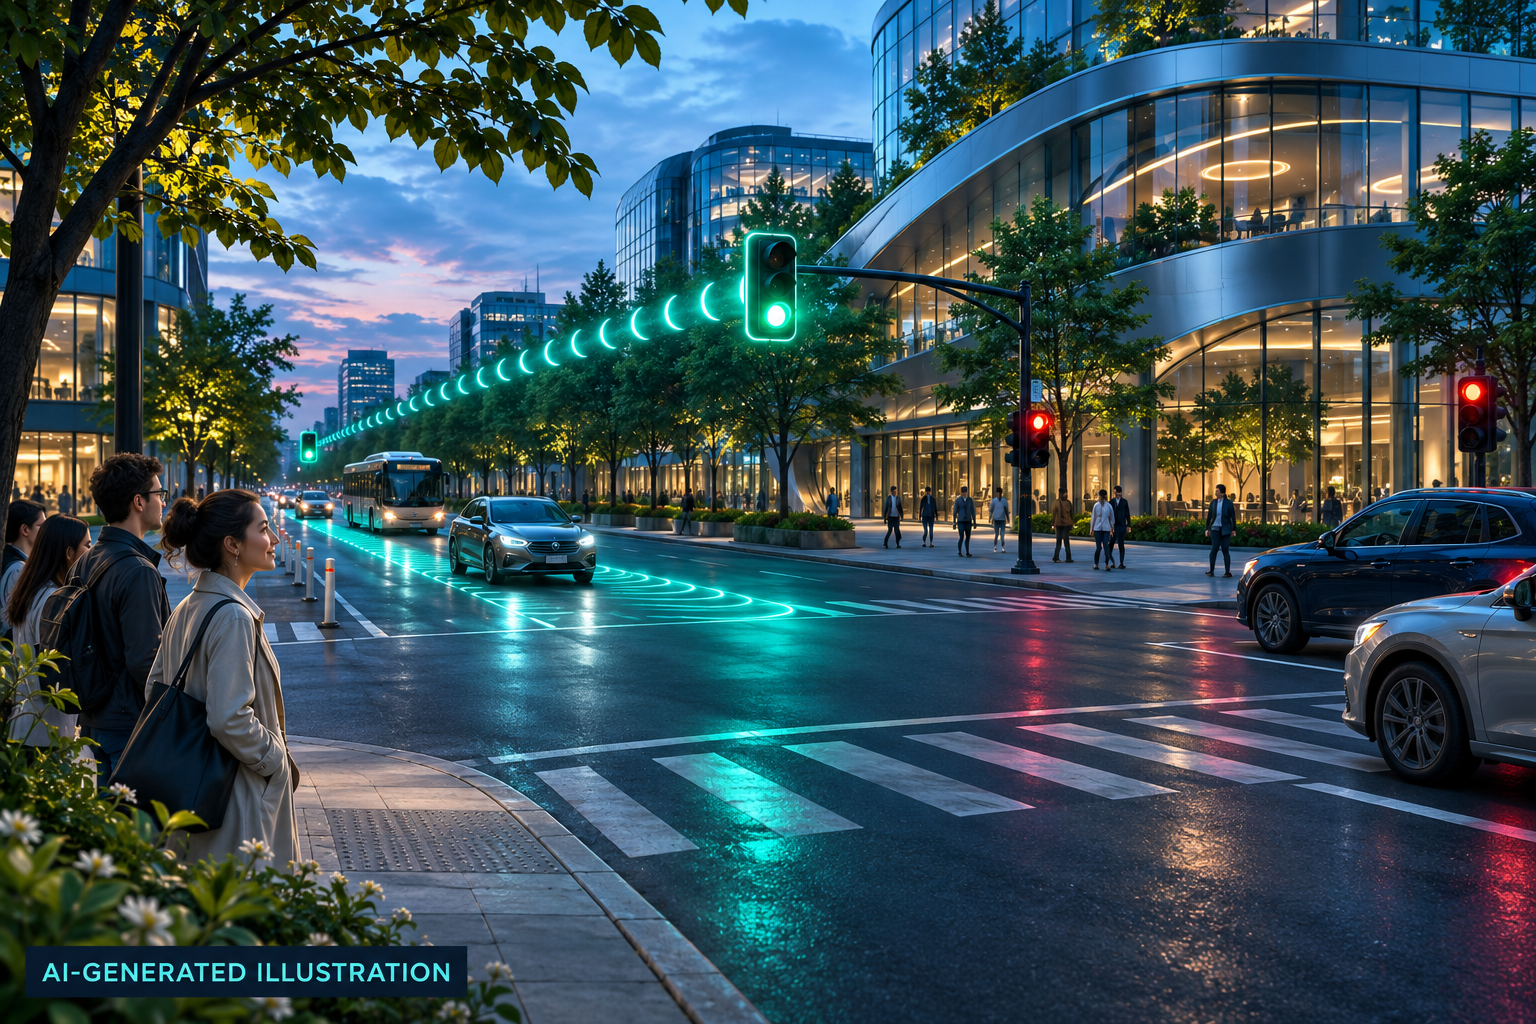
- Average delay reduction
- 13.5% in the reported second phase
- Unnecessary stops
- 20% fewer on average at retimed intersections
- Implementation
- City engineers review and change timings
How the idea works
Find repeated queues
Traffic trends reveal intersections with timing mismatches.
Retune existing signals
Engineers review and apply a concrete timing adjustment.
Measure and keep or revert
Observed delays determine whether the change remains.
The queue survives another green light
At a badly timed intersection, a driver may wait through several signal cycles even when nearby junctions have spare capacity. Project Green Light uses traffic patterns to find opportunities to change the timing or coordination of existing lights. Boston’s engineers then decide whether a recommendation suits the local street and implement the change in their own system.
The model looks for repeated stopping
Google Maps driving trends help model traffic flow and identify places where demand and signal timing do not fit well. The recommendation might change green time or coordinate neighbouring intersections. The key is that the output names an adjustable setting. It does not require the city to hand autonomous control of its traffic network to the model.
Boston measured the effect on real streets
The city reported an average 13.5% reduction in delay and 20% fewer unnecessary stops across newly retimed intersections in the pilot’s second phase, evaluated with traffic-analytics company INRIX. At Atlantic Avenue and Richmond Street, reported delay fell 21%. These are location-specific operational results; the average does not describe every Boston journey or every intersection.
Sources: [1]
Keep changes that help, reverse those that do not
Google’s current operating instructions ask engineers to review local constraints, monitor changes for four to eight weeks and revert recommendations with negative results. That feedback loop is as important as the initial prediction. Reduced stopping may reduce fuel use, but Boston’s fuel figures are estimates; the strongest demonstrated outcome here is improved traffic flow at the tested locations.