BIGGER PICTURE Disaster preparedness
Which rain-soaked slope deserves attention first?
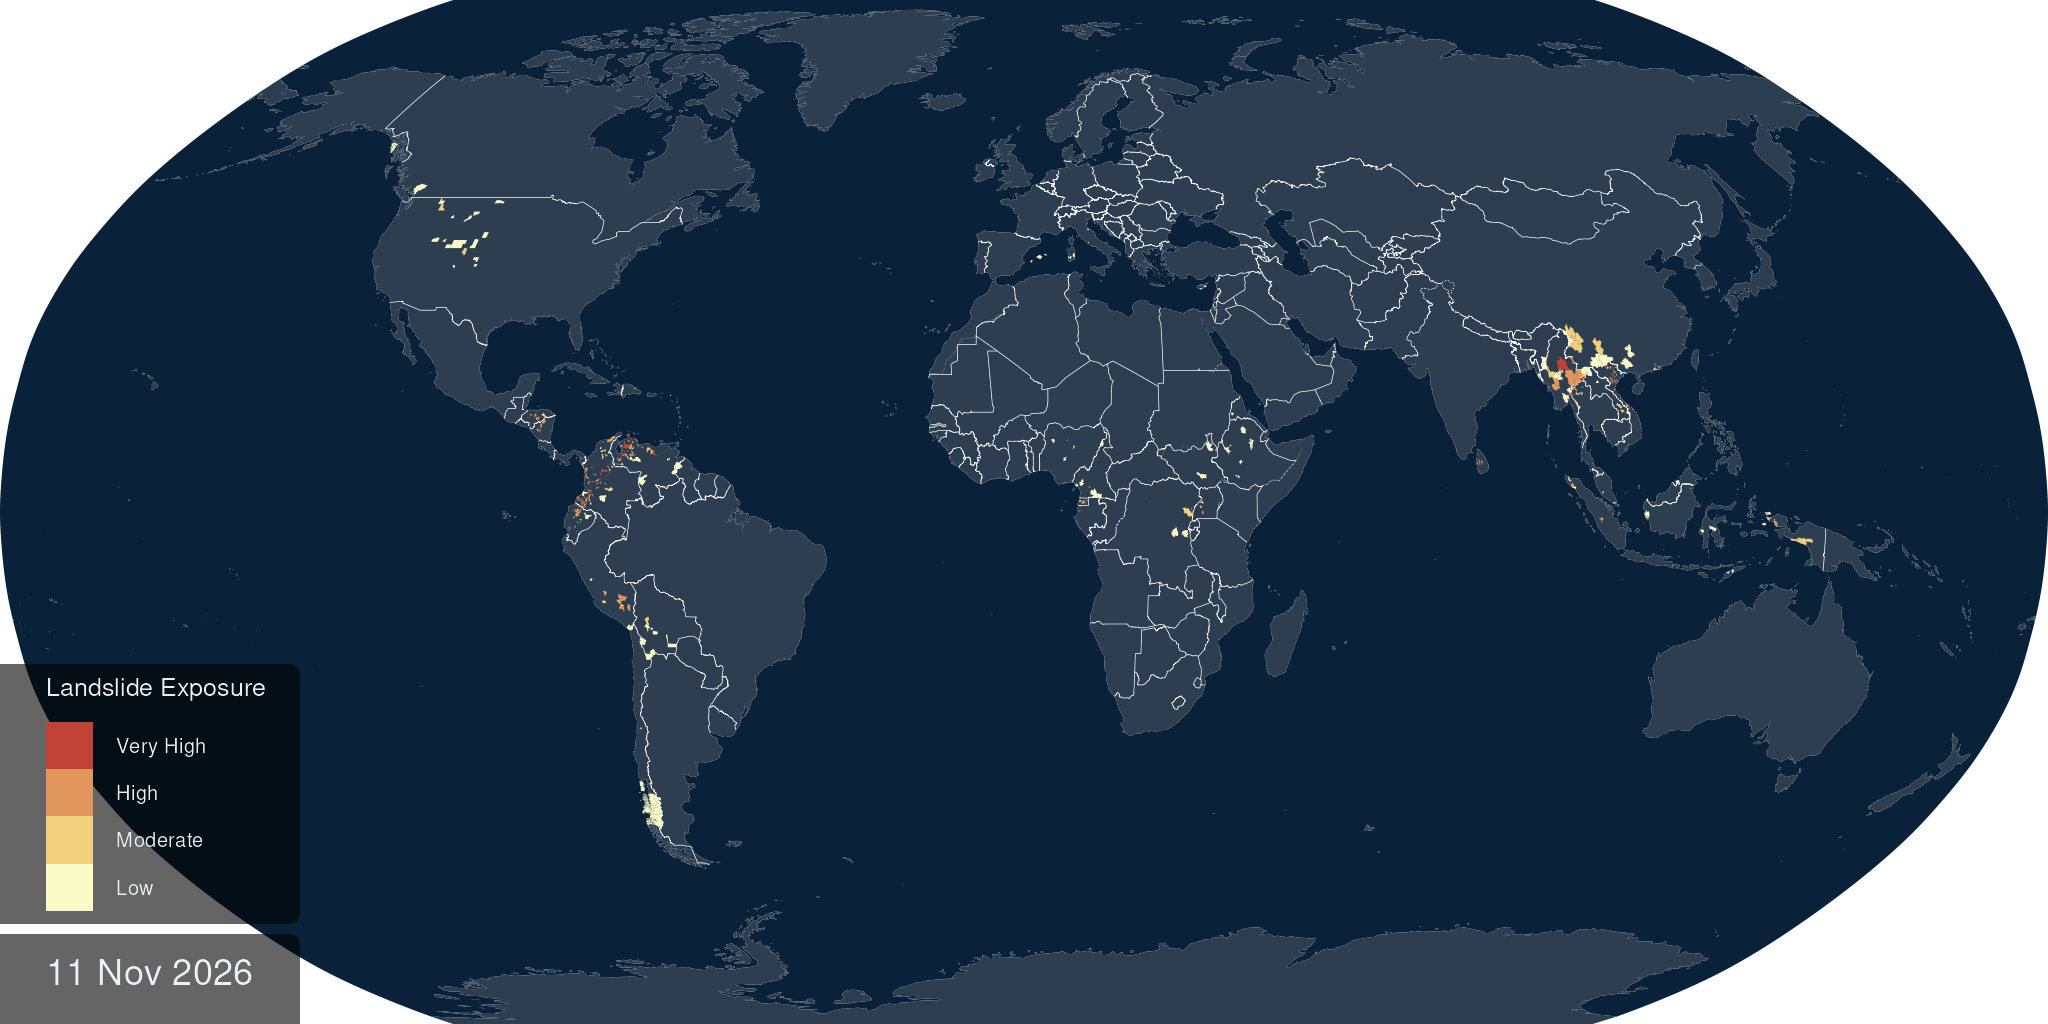
NASA combines rainfall from space with conditions on the ground to help responders find places where a landslide may be developing.
 Source illustration
- Spatial scale
- Approximately 1 km
- Information combined
- Rain, slope, soil moisture and geology
- Operational link
- DisasterAWARE risk and exposure maps
How the idea works
Measure rain and terrain
Satellite rainfall meets moisture and slope data.
Estimate slope failure
Patterns learned from past landslides produce probabilities.
Prioritize exposed places
Responders inspect risk near people and access routes.
Rain falls on very different ground
The model combines satellite-based precipitation with slope, soil moisture, snow, geology and distance to faults. Historical landslides teach it which combinations are associated with failure. Version 2 works at roughly one-kilometre resolution. The resulting probabilities describe hazardous conditions; they do not establish that a particular house or road has already been hit.
A map becomes a response priority
Through the Pacific Disaster Center, LHASA information enters DisasterAWARE, where hazard can be viewed alongside exposed people, roads, bridges and hospitals. NASA reported use by teams in El Salvador, Honduras and the Dominican Republic during the 2023 rainy season. In 2025, its flood-response material again included LHASA as a tool for assessing compound hazards.
A useful signal needs dependable delivery
The open-source repository adds a practical caveat: NASA’s shared predictions are supplied on a best-effort basis, with downtime; users needing a fully operational service should run the system themselves. That distinction matters for emergency planning. This is documented decision support and wider access to hazard information, not evidence that a measured number of deaths was prevented.